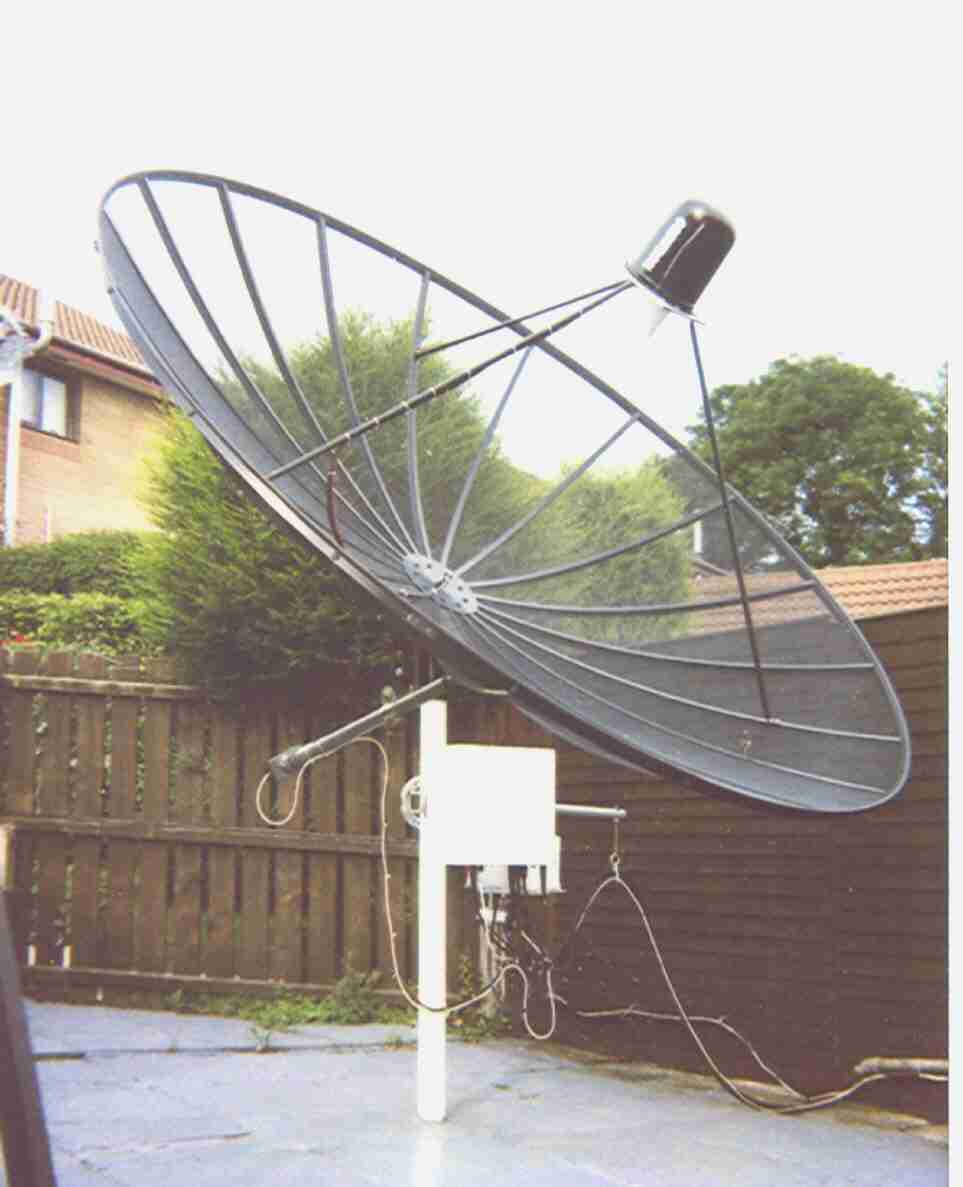
 Fig 1: 3m Dish of the 1.42GHz telescope. |
Solar transit at 1420MHz with 3m dish. Click on graph to enlarge. |
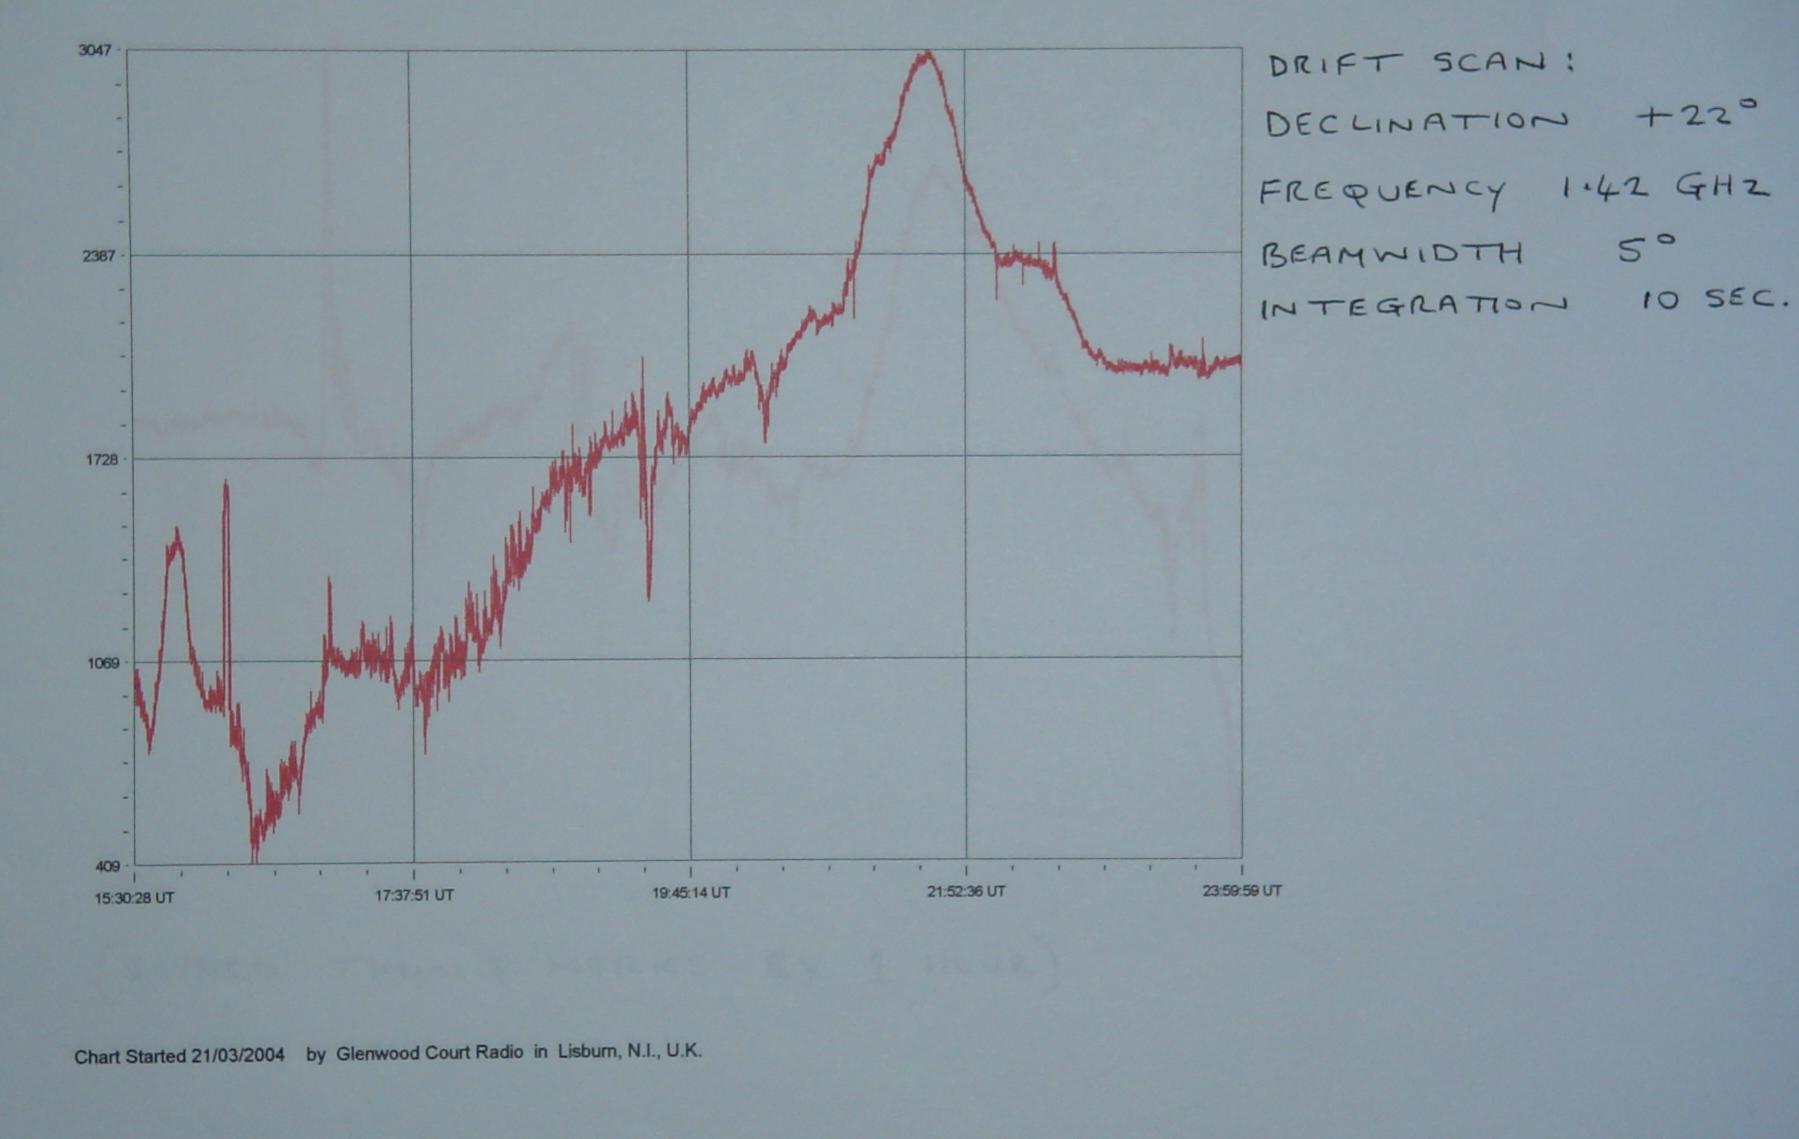 Drift scan at 1420MHz with 3m dish. Declination=22deg. Click on graph to enlarge. |
|
There are three Radio Telescopes in operation at this observatory, two of which are illustrated. At time of writing, research is carried out at 1.42 GHz (the emission line of neutral Atomic Hydrogen), continuum observations at 4 GHz, and Solar/Jovian monitoring at frequencies around 20 MHz. Equipment is currently under construction to enable indirect detection of solar flare events at VLF.
The 1.42 GHz Radio Telescope is a dual-mode ('Total Flux' and 'Modulation') radiometer employing a commercial 3 metre mesh dish (an ORBITRON SX10) on a meridian transit mounting (Fig.1); an LNA, calibration noise source and directional coupler are located directly at the feed horn, with the converter and I. F. amplifier mounted in a hermetically sealed housing below the dish.
|
Fig 1: 3m Dish of the 1.42GHz telescope. |
Solar transit at 1420MHz with 3m dish. Click on graph to enlarge. |
|
Drift scan at 1420MHz with 3m dish. Declination=22deg. Click on graph to enlarge. |
|
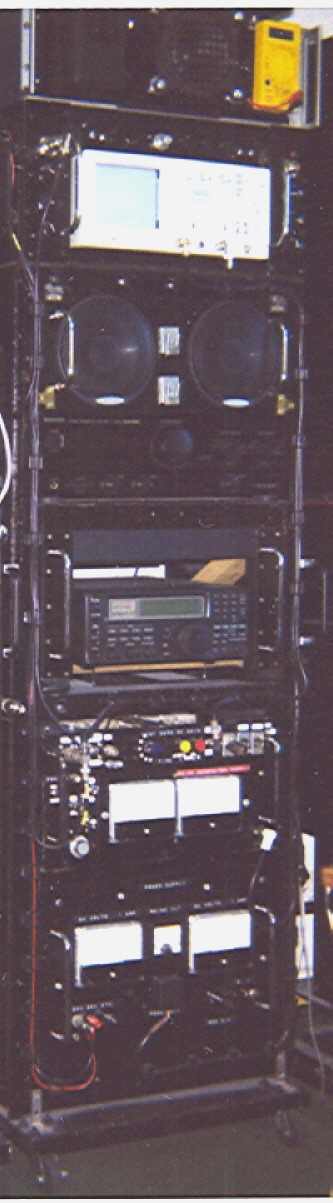
The I.F. detector output is fed indoors to a post-detector signal processing rack in the control room (Fig.2). Two I.F. bandwidths are available, 15 KHz and 100 KHz.
The 4 GHz radiometer is 'Total Flux' only and utilizes a commercial 2.6 metre mesh dish (a KTI CKD-8.5), also on a meridian transit mounting (Fig.3).
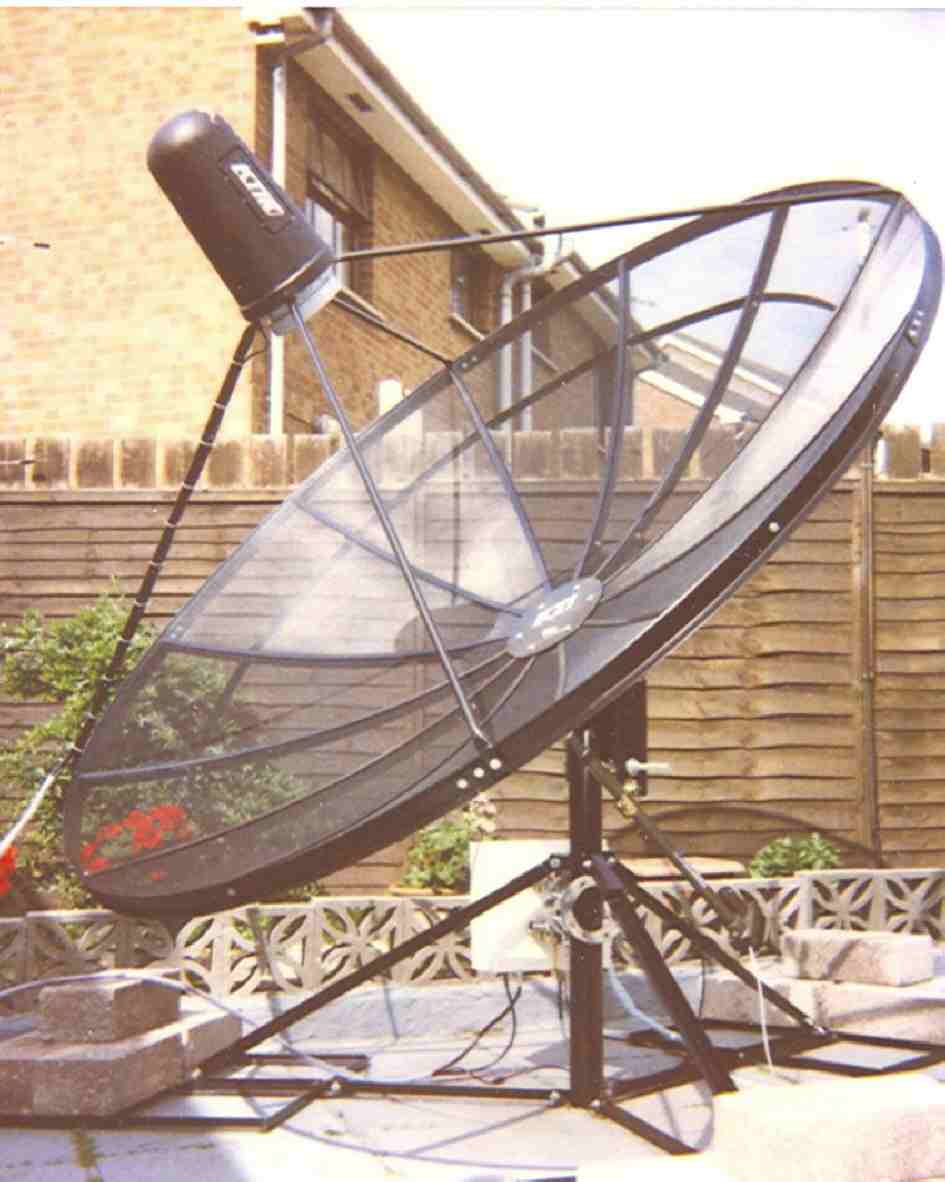 Fig 3: 2.6m Dish of the 4GHz telescope. |
Solar transit at 4GHz with 2.6m dish. Click on graph to enlarge. |
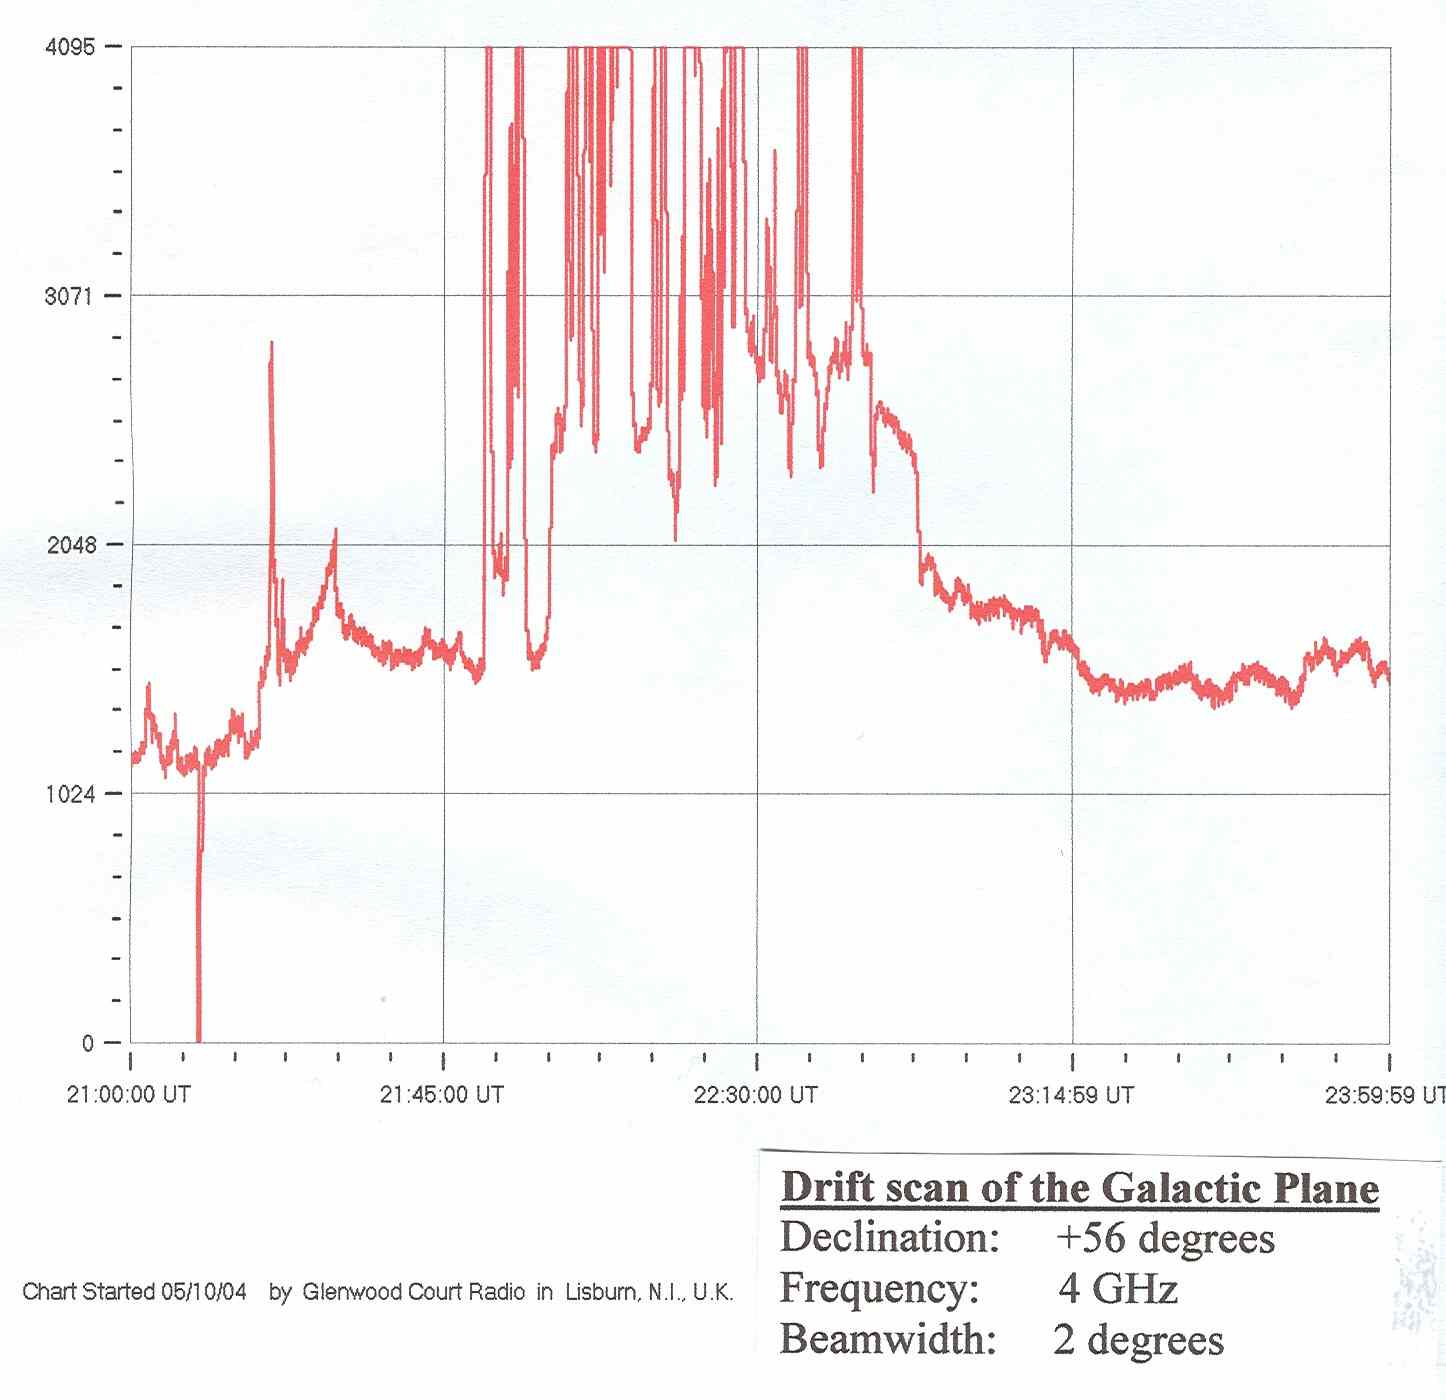 Galactic plane scan. Click on graph to enlarge. |
|
A 'C' Band 15 degrees Kelvin converter at the feed horn sends a 500 MHz wide I.F. signal to a processing rack in the control room (Fig.4).
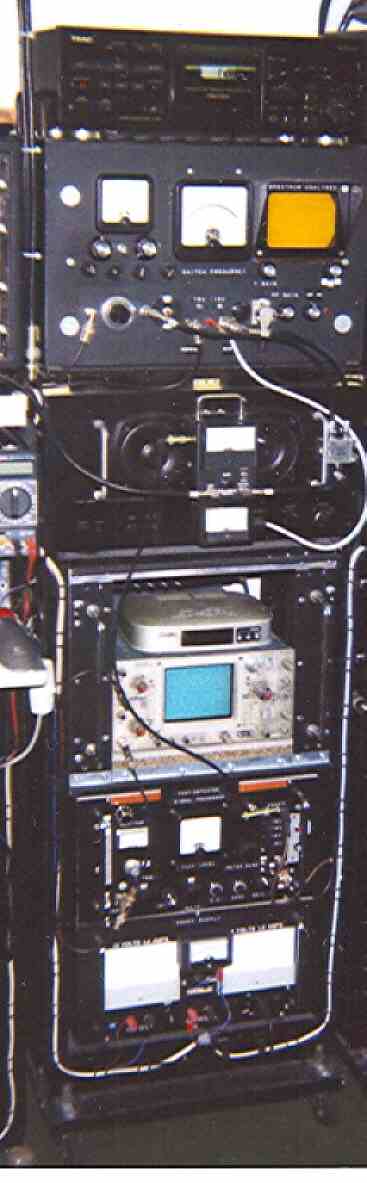
Here, the full 500 MHz I. F. can be utilized, or a UHF receiver acting as a 'tunable I.F.' can provide a 35 MHz narrow-band signal prior to detection and further signal processing.
'Radio SkyPipe' data logging software is extensively employed, and all radiometer outputs are monitored on computer screens at the control desk (Fig.5), where printers can generate hard-copy graphs of observational runs. Various optical and radio sky map programmes are also available.
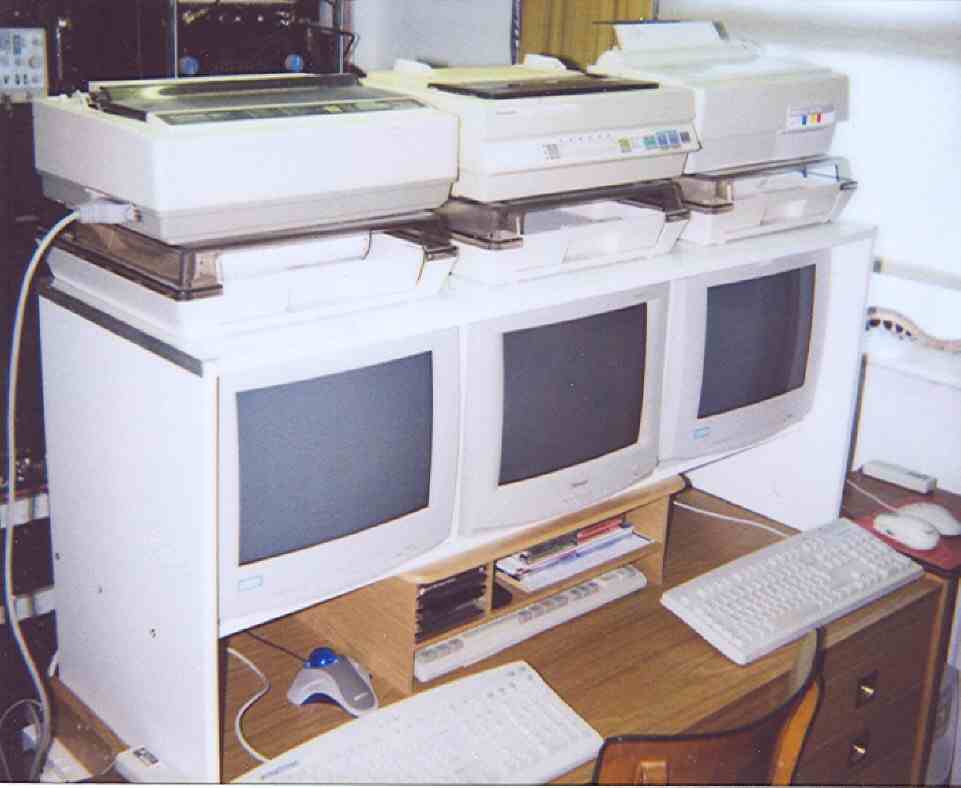 Fig 5: Control desk. |
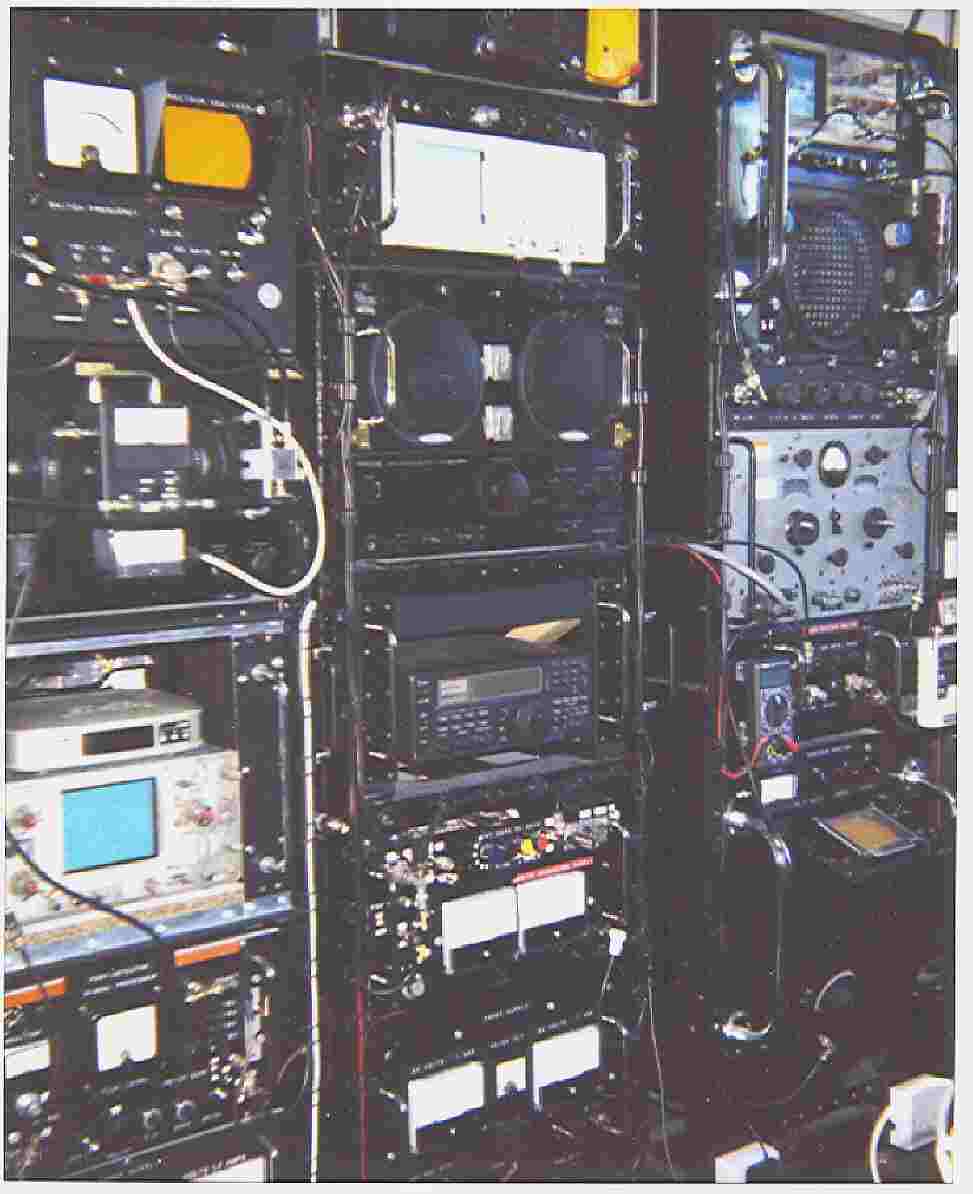 Fig 6: General view of equipment racks. |